Key takeaways
• Based on issues our support team encounters when helping artists troubleshoot render jobs, long render times are often caused by inefficient settings, unnecessary scene complexity, or calculations that add little visible improvement.
• Long render times are often caused by inefficient render settings, unnecessary scene complexity, or calculations that add little visible improvement.
• More samples do not always produce a noticeably better image. Testing sample levels and using denoising or adaptive sampling can lead to faster rendering.
• Render resolution has a direct impact on render time, so 4K rendering is usually unnecessary during previews and look development.
• Scene optimization matters. Heavy geometry, oversized textures, unseen objects, and unnecessary light calculations can all hurt rendering performance.
• CPU vs GPU rendering can make a significant difference depending on the renderer, hardware, scene, and available memory.
• A render test using representative frames can expose problems before you commit an entire animation to rendering.
• Measuring frame render time before a full animation makes it easier to calculate render time and spot unexpectedly expensive frames.
TL;DR
Why does rendering take so long? In many cases, the problem is not one demanding effect or a lack of powerful hardware. Long render times often come from a combination of unnecessarily high samples, excessive render resolution, complex geometry, oversized textures, expensive lighting calculations, the wrong render device, and insufficient testing.
Based on the kinds of scenes and rendering issues our team encounters when helping GarageFarm.NET users, many of these problems can be caught before the full render begins. Better render settings, sensible scene optimization, and a small render test can reduce wasted rendering time without sacrificing the quality that actually matters in the final image.
The mistakes below are based in part on issues our GarageFarm.NET support team encounters while helping artists troubleshoot scenes and render jobs. They aren't theoretical problems. They're the kinds of settings, scene choices, and workflow mistakes that can turn otherwise manageable jobs into unnecessarily long renders.
How to avoid common mistakes that increase render time
Render time has a sneaky way of getting out of control. At first, it looks like a small issue. One frame takes a few minutes longer than expected. A Blender scene needs a late lighting change. A texture file goes missing. A camera setup fails after switching output format. Then someone notices an asset update broke consistency across a whole batch of frames.

Suddenly, the team is not just waiting on renders. They are waiting on re-renders, approvals, fixes, and more re-renders.
That is why render time is rarely just a technical problem. It is usually a production problem wearing a technical disguise.
We see this firsthand through the scenes and render jobs our support team helps troubleshoot. Slow rendering is not always caused by one obvious bottleneck. Often, several small decisions made during scene preparation add up until the final render takes far longer than expected.
The good news is that many of these rendering issues are preventable. Before assuming you need faster hardware, check whether the scene is asking your renderer to calculate things the final image does not actually need.
Using too many samples
More samples do not always mean a better render. They usually mean a slower render.
How to Render Faster In Blender Cycles - by BadgerBricks
In Blender Cycles and other path-traced renderers, increasing the sample count can reduce noise. After a certain point, however, every additional sample produces a smaller visible improvement while continuing to increase render time.
This is one of the easiest ways to accidentally hurt rendering performance. A scene might look nearly identical at 256 and 1024 samples once denoising is applied. Across hundreds or thousands of animation frames, however, that difference can turn into hours of additional rendering.
One pattern we've seen is artists increasing samples to solve noise without first checking whether the extra samples produce a meaningful visual improvement. On a single frame, the difference may seem harmless. Across hundreds of frames, it can add a significant amount of unnecessary render time.
What to do instead
Run a render test at several sample levels before committing to the final render. For example, compare the same representative frame at 64, 128, 256, and 512 samples.
Look closely at noise, shadows, reflections, fine texture detail, and difficult areas such as indirect lighting. Use the lowest sample count that produces acceptable results.
If your renderer supports adaptive sampling, use it where appropriate. Adaptive sampling allows cleaner parts of the image to finish sooner while concentrating more work on areas that still contain noise.
The goal is not to use the lowest possible render settings. It is to stop spending render time on calculations that no longer create a meaningful improvement.
Treating noise as something only samples can fix
3 Tips for FASTER Renders in Blender Cycles [2025] - by The Blenderender
Noise often appears in scenes with indirect lighting, glossy reflections, interiors, product shots, transmission, or low-light conditions.
The common reaction is to keep increasing samples until the noise disappears. That can work, but it is not always the most efficient solution.
Noise may also be affected by the lighting setup, difficult light paths, materials, bounce settings, and the way the renderer samples the scene. Increasing samples across the entire image can therefore make rendering much slower while addressing only a small problematic area.
What to do instead
Identify where the noise is coming from before increasing the global sample count.
Test denoising first, then look at the lighting and materials in the noisy area. Improving the lighting setup can sometimes reduce noise more efficiently than simply increasing samples.
Depending on the renderer and scene, adaptive sampling, sensible bounce limits, clamping or firefly controls, and optimized glossy or transmission paths can also help.
Compare the results at full viewing size. If increasing the samples makes almost no visible difference after denoising, those extra samples are probably not buying you much.
Rendering at unnecessary resolution
RDR2 Graphics Test — 720p vs 1080p vs 2K vs 4K | Best Resolution Comparison! - by QuickScope Gaming
Render resolution has a direct effect on how much work your renderer has to perform.
A 3840 × 2160 4K image contains four times as many pixels as a 1920 × 1080 image. That does not mean every 4K render will take exactly four times as long, since render time depends on many other factors, but high resolution rendering still requires substantially more pixel calculations.
That makes 4K rendering particularly wasteful during early tests when you are only checking lighting, composition, materials, or camera placement.
What to do instead
Use a lower render resolution for previews and increase it when the scene is ready for final output.
A 50% resolution preview render can still reveal obvious problems such as incorrect camera framing, missing textures, noisy shadows, failed modifiers, bad materials, or misplaced objects.
Reserve the full render resolution for stages where you actually need to inspect fine detail.
If the final image or animation will be delivered in 1080p, there is also little reason to render it in 4K unless you need the extra resolution for cropping, reframing, compositing, downsampling, or another part of the production workflow.
Always match the resolution to the final use rather than automatically choosing the largest output your system can handle.
Leaving caustics and extra light bounces on
Real-Time Caustics? This New Blender Addon Makes Cycles a Real Threat! Shaders Plus Overview - by SMOUSE
Caustics, high bounce settings, and complicated lighting setups can all increase render time.
Sometimes they are essential. A glass product shot, reflective interior, or scene where refracted light is an important part of the image may genuinely need those calculations. In many other scenes, the visual difference is minor.
In path-traced renderers such as Blender Cycles, bounce settings determine how many times light can reflect or pass through surfaces. Higher values can improve realism in certain situations, but they also give the renderer more work to do.
What to do instead
Reduce light bounces where the difference is not visible and limit or disable caustics when they do not contribute meaningfully to the shot.
Keep the lighting setup focused as well.
For architectural visualization, prioritize the daylight entering the space, important practical lights, and sources that visibly shape the room. For product visualization, concentrate on the reflections, rim lighting, contact shadows, and highlights that define the product.
Do not make the renderer calculate an expensive lighting effect simply because the option exists. Use it because the audience can actually see what it contributes.
Using too much geometry
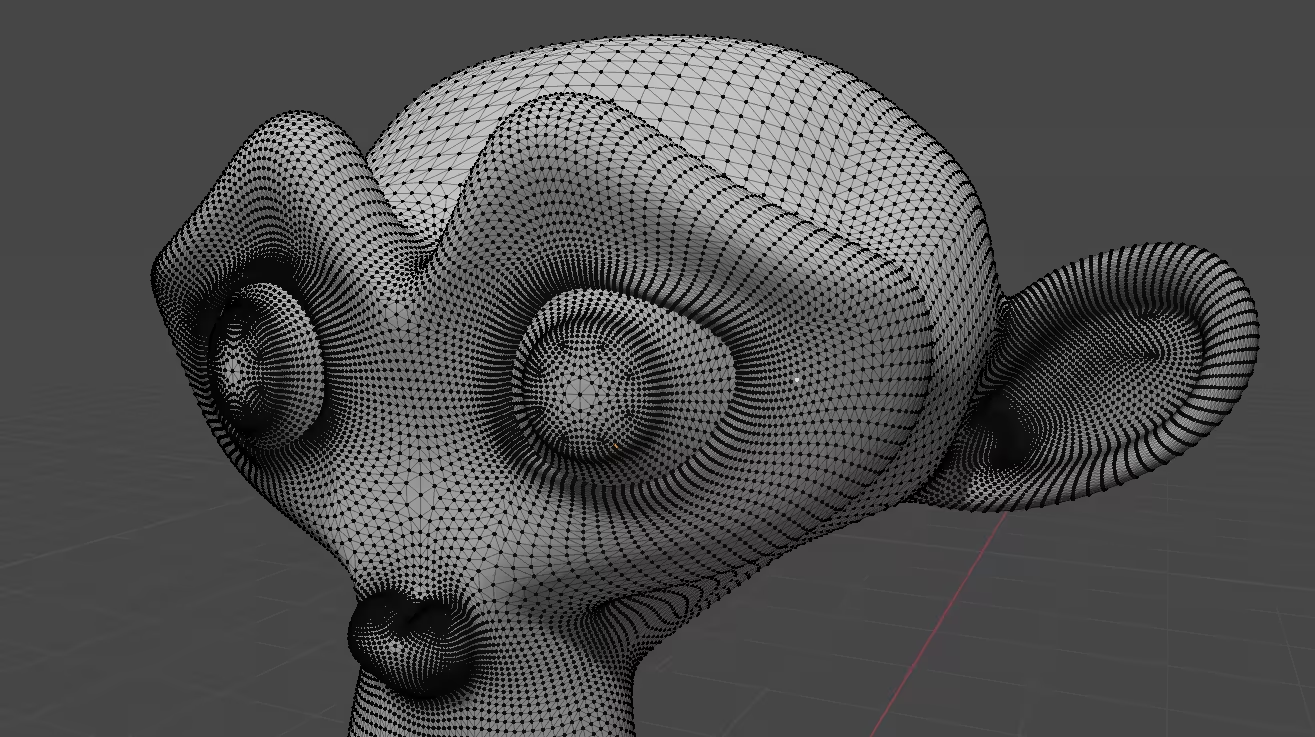
Scene complexity can affect both viewport responsiveness and final rendering performance.
High-poly meshes, dense subdivision, unnecessary bevel modifiers, unoptimized CAD imports, displacement, and large numbers of detailed objects can all make a scene heavier than it needs to be.
One highly detailed object may not cause a problem. Hundreds of them can.
This becomes especially important in architectural visualization and large environment scenes where objects that occupy only a few pixels may still contain thousands or millions of polygons.
What to do instead
Approach scene optimization according to what the camera can actually see.
Keep hero objects and foreground elements detailed, but simplify geometry as it moves farther from the camera. Reduce mesh density on background assets, use subdivision only where it creates a visible improvement, and remove unnecessary geometry from imported models.
For product renders, keep the product itself detailed while simplifying background props and supporting elements.
Also pay attention to displacement and procedural geometry. These can create far more render-time geometry than the base mesh suggests.
A good scene is not necessarily the scene with the most detail. It is the scene that puts detail where the final image needs it.
Using oversized textures everywhere
4K textures are USELESS! - by Visual Tech Art
Large textures can make a scene heavy, increase memory usage, slow scene loading, and contribute to stability problems.
A 4K or 8K texture can make sense on a close-up product label, foreground wall, or hero asset. The same texture resolution may be completely unnecessary on an object occupying a tiny part of the final frame.
Texture problems can also create rendering issues beyond speed. Missing texture paths, broken links, and unnecessarily large image files can increase memory requirements or cause materials to render incorrectly.
What to do instead
Choose texture resolution according to camera distance and how much screen space the object occupies.
Keep high-resolution textures where viewers can actually see the detail. Use smaller textures for distant props, hidden surfaces, heavily blurred elements, and background objects.
Review repeated assets as well. Instances and shared resources can often reduce unnecessary scene overhead compared with duplicating unique assets everywhere.
Before a large render, it is also worth checking for missing files, oversized textures, unused materials, and assets that are no longer part of the final shot.
Rendering objects the camera cannot see

3D scenes often contain far more than the final camera sees.
Objects may sit behind the camera, inside another room, behind walls, outside a window view, or completely blocked by other geometry. Even when an object is invisible in the final image, it may still consume memory or contribute to shadows, reflections, simulations, or other calculations.
This is an easy source of poor scene performance because nothing necessarily looks wrong. The artist only notices that the scene feels heavy or the render takes longer than expected.
What to do instead
Check the final camera view and identify objects that do not contribute to the shot.
Remove, hide, or disable unnecessary elements where doing so will not change important reflections, shadows, indirect lighting, or simulations.
In Blender, collections, view layers, camera visibility, and render visibility controls can help manage this.
For archviz, this might mean simplifying rooms and furniture the camera never sees. For product visualization, it could mean removing unused props, alternate packaging, hidden geometry, or lighting cards left over from previous setups.
Scene optimization should be based on contribution to the final image, not simply whether an object exists in the project.
Using the wrong render engine or device mode
Your choice of renderer and render device can have a major effect on render time.
In Blender, for example, Eevee is useful for fast previews and work that suits real-time rendering, while Cycles is designed for physically based path tracing and more realistic lighting. Using the heavier option for every preview can make iteration unnecessarily slow.
Hardware configuration matters too. CPU vs GPU rendering can produce very different performance depending on the renderer, scene, hardware, and available memory.
GPU rendering is often significantly faster for workloads that are well suited to parallel processing, but it is not automatically the best option for every scene. A GPU can run into VRAM limitations when working with very large textures, geometry-heavy scenes, or other memory-intensive assets. CPU rendering may be slower in many cases but can have access to much more system memory.
What to do instead
Choose the render engine according to the job rather than habit.
Use faster preview modes while building and reviewing the scene, then switch to the final renderer when you need its lighting and shading accuracy.
Also verify which render device is actually being used.
In Blender Cycles, check whether the scene is rendering on the CPU or GPU and confirm that the appropriate CUDA, OptiX, HIP, or other supported backend is enabled for your hardware.
If GPU rendering performs poorly or fails, check VRAM usage before assuming the graphics card itself is too slow. Heavy geometry, oversized textures, subdivision, and other scene complexity can push GPU memory beyond its limits.
The fastest hardware cannot compensate for render settings that are poorly matched to the scene.
Not testing one frame before the full animation

One of the most expensive mistakes is starting an entire animation render without first running a proper render test.
This is also one of the problems our support team regularly tries to help users avoid.
A missing texture, incorrect output format, noisy shadow, broken modifier, bad camera move, unexpected simulation, or incorrect render setting might not become obvious until many frames have already finished.
If the problem affects the entire sequence, those frames may need to be rendered again.
What to do instead
Start with one representative test frame. Then render a short frame range.
Do not test only frame one. For an animation, choose frames that represent different conditions in the sequence, such as a dark frame, a bright frame, a close-up, a frame with fast motion, and a particularly complex part of the scene.
Check the resulting files in the software where they will actually be composited, edited, reviewed, or delivered.
GarageFarm.NET also supports test jobs, which allow you to check a scene on the render farm before committing the complete frame range. This can help catch asset problems, unexpected frame render times, output issues, or scene compatibility problems before they affect the full job.
A good render test is not wasted rendering. It is a small amount of rendering used to avoid a much larger amount of wasted rendering.
Calculate render time before committing to the full animation
A test frame also gives you a rough way to calculate render time.
For a simple estimate:
Average frame render time × total number of frames = estimated total render time
For example, if your representative frames take an average of 30 seconds and the animation contains 1,200 frames:
30 seconds × 1,200 frames = 36,000 seconds, or about 10 hours of rendering
Do not rely on a single easy frame for the estimate. Frame render time can change throughout an animation as geometry, lighting, particles, simulations, reflections, or camera views become more complex.
Test several representative frames and calculate an average. It is also useful to note the slowest frame so you have a better idea of the range you may encounter.
On a render farm, the total processing requirement still matters, but the wall-clock completion time can be much shorter because multiple frames can be rendered in parallel across many machines.
This kind of render time estimation does not need to be perfect. Its main purpose is to reveal when a job that looks manageable at one frame becomes surprisingly expensive across hundreds or thousands of frames.
Conclusion: the real goal is not just faster renders
Faster rendering usually does not come from one magic setting.
It comes from removing calculations that do not noticeably improve the final image. That might mean reducing unnecessary samples, choosing an appropriate render resolution, simplifying geometry the camera barely sees, using sensible texture sizes, limiting expensive lighting calculations, selecting the right render device, or catching a problem with a render test before it spreads across an entire sequence.
These are also the kinds of issues that become much easier to fix before a large render begins than after hundreds of frames have already been processed.
Making better decisions per hour is what efficient rendering actually buys you. More chances to review, more room to refine, and more freedom to respond to notes without blowing up the schedule.
Render time becomes dangerous when teams treat it like fate, but it becomes manageable when they treat it like part of the production design. Fix the habits that make a scene unnecessarily expensive, and faster renders tend to follow.
Register Now and Get $50 FREE Credits!